美国经济分析局:2026年第三季度实际GDP年化增长3.4%,PCE价格指数上涨2.1%
GDP (Advance Estimate), 3rd Quarter 2026
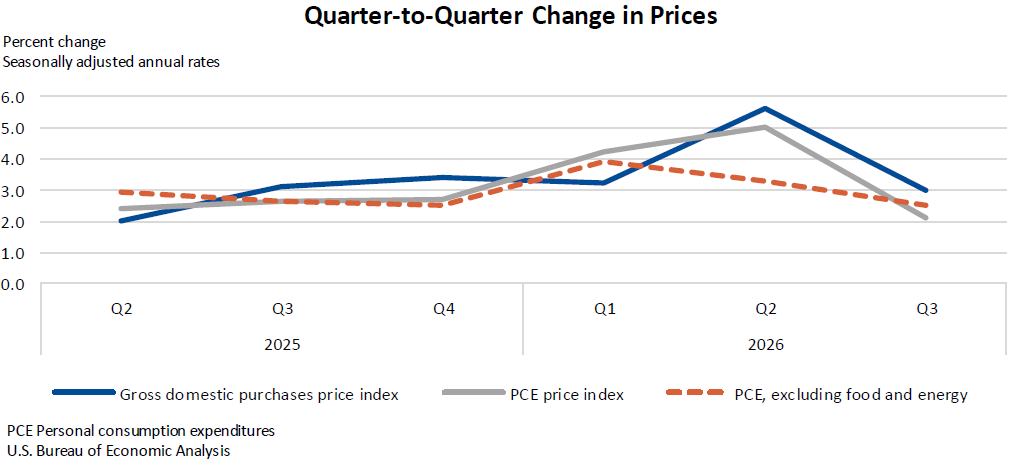
美国经济分析局公布的2026年第三季度预估显示,实际GDP按年率增长3.4%,高于第二季度的2.2%。投资、消费者支出和政府支出带动增长,出口下降部分抵消增幅;进口增加。私人国内购买者最终销售增长4.9%,第二季度为4.6%;PCE价格指数上涨2.1%,剔除食品和能源后上涨2.5%。
GDP增速加快,私人国内购买者最终销售保持增长;同期PCE价格指数涨幅低于第二季度。
Real gross domestic product (GDP) increased at an annual rate of 3.4 percent in the third quarter of 2026 (July, August, and September), according to the advance estimate released today by the U.S. Bureau of Economic Analysis (BEA). In the second quarter, real GDP increased 2.2 percent.
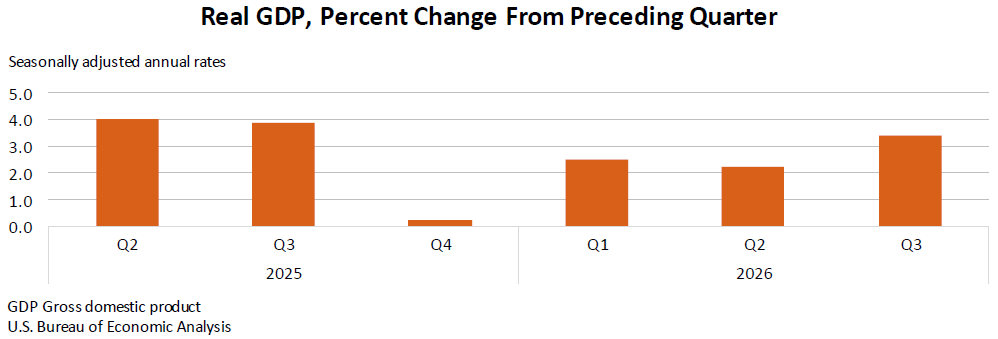
The contributors to the increase in real GDP in the third quarter were increases in investment, consumer spending, and government spending that were partly offset by a decrease in exports. Imports, which are a subtraction in the calculation of GDP, increased. For more information, refer to the "Technical Notes" below.
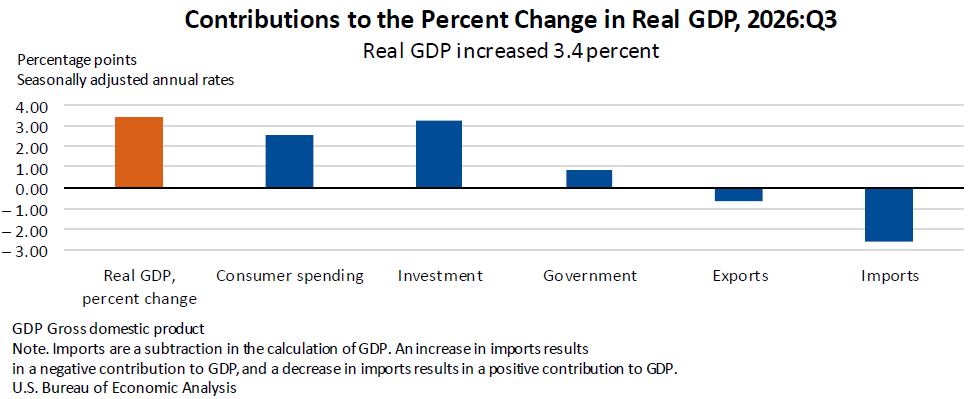
Compared to the second quarter, the acceleration in real GDP in the third quarter primarily reflected an acceleration in investment and an upturn in government spending that were partly offset by a downturn in exports. Imports increased more in the third quarter than in the second quarter.
Real final sales to private domestic purchasers, the sum of consumer spending and gross private fixed investment, increased 4.9 percent in the third quarter, compared with an increase of 4.6 percent in the second quarter.
The price index for gross domestic purchases increased 3.0 percent in the third quarter, compared with an increase of 5.6 percent in the second quarter. The personal consumption expenditures (PCE) price index increased 2.1 percent, compared with an increase of 5.0 percent, and the PCE price index, excluding food and energy increased 2.5 percent, compared with an increase of 3.3 percent.
| Real GDP and Related Measures [Percent change (SAAR) from 2026:Q2 to 2026:Q3] | |
|---|---|
| Advance Estimate | |
| Real GDP | 3.4 |
| Current-dollar GDP | 5.6 |
| Real final sales to private domestic purchasers | 4.9 |
| Gross domestic purchases price index | 3.0 |
| PCE price index | 2.1 |
| PCE price index, excluding food and energy | 2.5 |
| SAAR seasonally adjusted at annual rates U.S. Bureau of Economic Analysis | |
For definitions, statistical conventions, updates to GDP, and more information about national statistics, visit “Additional Information.”
Next release: November 25, 2026, at 8:30 a.m. EST
GDP (Second Estimate) and Corporate Profits, 3rd Quarter 2026
The full release schedule for 2027 is available on BEA's website.
Technical Notes
Sources of change for real GDP
Real GDP increased at an annual rate of 3.4 percent (0.8 percent at a quarterly rate 1) in the third quarter, reflecting increases in investment, consumer spending, and government spending that were partly offset by a decrease in exports. Imports, which are a subtraction in the calculation of GDP, increased.
More information on the source data and BEA assumptions that underlie the third-quarter estimate is shown in the key source data and assumptions table.
- The increase in investment primarily reflected increases in private inventory investment and in equipment.
- The largest contributors to the increase in private inventory investment were wholesale trade and manufacturing (both led by nondurable goods industries), based primarily on Census Bureau inventory book value data.
- Within equipment, the increase was led by information processing equipment (mainly computers and peripheral equipment), based primarily on data for imports from the U.S. Census Bureau-BEA U.S. International Trade in Goods and Services report and the Census Bureau Advance Economic Indicators Report for September.
- The increase in consumer spending reflected increases in both services and goods.
- Within services, the increase was led by health care (mainly hospitals and outpatient services), based primarily on U.S. Bureau of Labor Statistics’ Current Employment Statistics, and food services and accommodations (mainly purchased meals and beverages), based on Census Bureau Monthly Retail Trade Survey (MRTS) data.
- Within goods, the increase was led by other nondurable goods (mainly prescription drugs), based on Census Bureau MRTS data.
- Within government spending, the increase was more than accounted for by federal government spending, led by nondefense consumption expenditures. The pattern of nondefense spending primarily reflected sales of crude oil from the Strategic Petroleum Reserve, based on data from the U.S. Department of Energy. Within the National Economic Accounts, sales are deducted from government consumption expenditures. In the third quarter, sales from the Strategic Petroleum Reserve were less than sales in the second quarter, resulting in an increase in consumption expenditures. Because the oil sold by the government is reflected as an increase in other components of GDP, there is no direct effect on GDP.
- Exports and imports primarily reflected Census Bureau-BEA U.S. International Trade in Goods and Services data as well as the Census Bureau Advance Economic Indicators Report for September. The decrease in exports primarily reflected a decrease in goods (led by petroleum and related products). The largest contributor to imports was capital goods, except automotive.
Related Data Tables
For the estimates highlighted in this release, as well as historical time series for these estimates, see the following data tables in BEA’s Interactive Data Application.
Table 1.1.1. Percent Change From Preceding Period in Real Gross Domestic Product
Table 1.5.2. Contributions to Percent Change in Real Gross Domestic Product, Expanded Detail
Table 1.4.1. Percent Change From Preceding Period in Real Gross Domestic Product, Real Gross Domestic Purchases, and Real Final Sales to Domestic Purchasers
Table 1.6.7. Percent Change From Preceding Period in Prices for Gross Domestic Purchases
Note. With the next release of GDP, today’s data will be superseded, and the links above will reflect the latest data. The original data featured in this release can then be accessed in BEA’s Data Archive.
来源:美国经济分析局 · GDP与PCE · bea.gov