BEA:美国跨国企业2024年全球就业增至4420万人,增加值升至7.4万亿美元
Activities of U.S. Multinational Enterprises, 2024
美国经济分析局公布的初步统计显示,2024年美国跨国企业全球就业同比增长0.9%至4420万人,其中美国母公司就业为2990万人,外国关联公司就业为1430万人。全球增加值同比增长8.0%至7.4万亿美元;全球房地产、厂房和设备支出增长7.1%至1.2万亿美元,研发支出增长10.1%至6227亿美元。2023年数据已修订;BEA称此次首次发布美国母公司在国内研发和资本支出中的占比统计。
数据呈现了美国跨国企业2024年全球就业、增加值、资本支出和研发支出的变化,并区分美国母公司与多数持股的外国关联公司。
Worldwide employment by U.S. multinational enterprises increased 0.9 percent to 44.2 million workers in 2024 (preliminary) from 43.8 million workers in 2023 (revised), according to statistics released today by the U.S. Bureau of Economic Analysis on the operations and finances of U.S. parent companies and their majority-owned foreign affiliates.
Employment in the United States by U.S. parents increased 0.1 percent to 29.9 million workers in 2024. U.S. parents accounted for 67.6 percent of worldwide employment by U.S. multinational enterprises (MNEs), down from 68.1 percent in 2023. Employment abroad by foreign affiliates of U.S. MNEs increased 2.7 percent to 14.3 million workers and accounted for 32.4 percent of employment by U.S. MNEs worldwide.
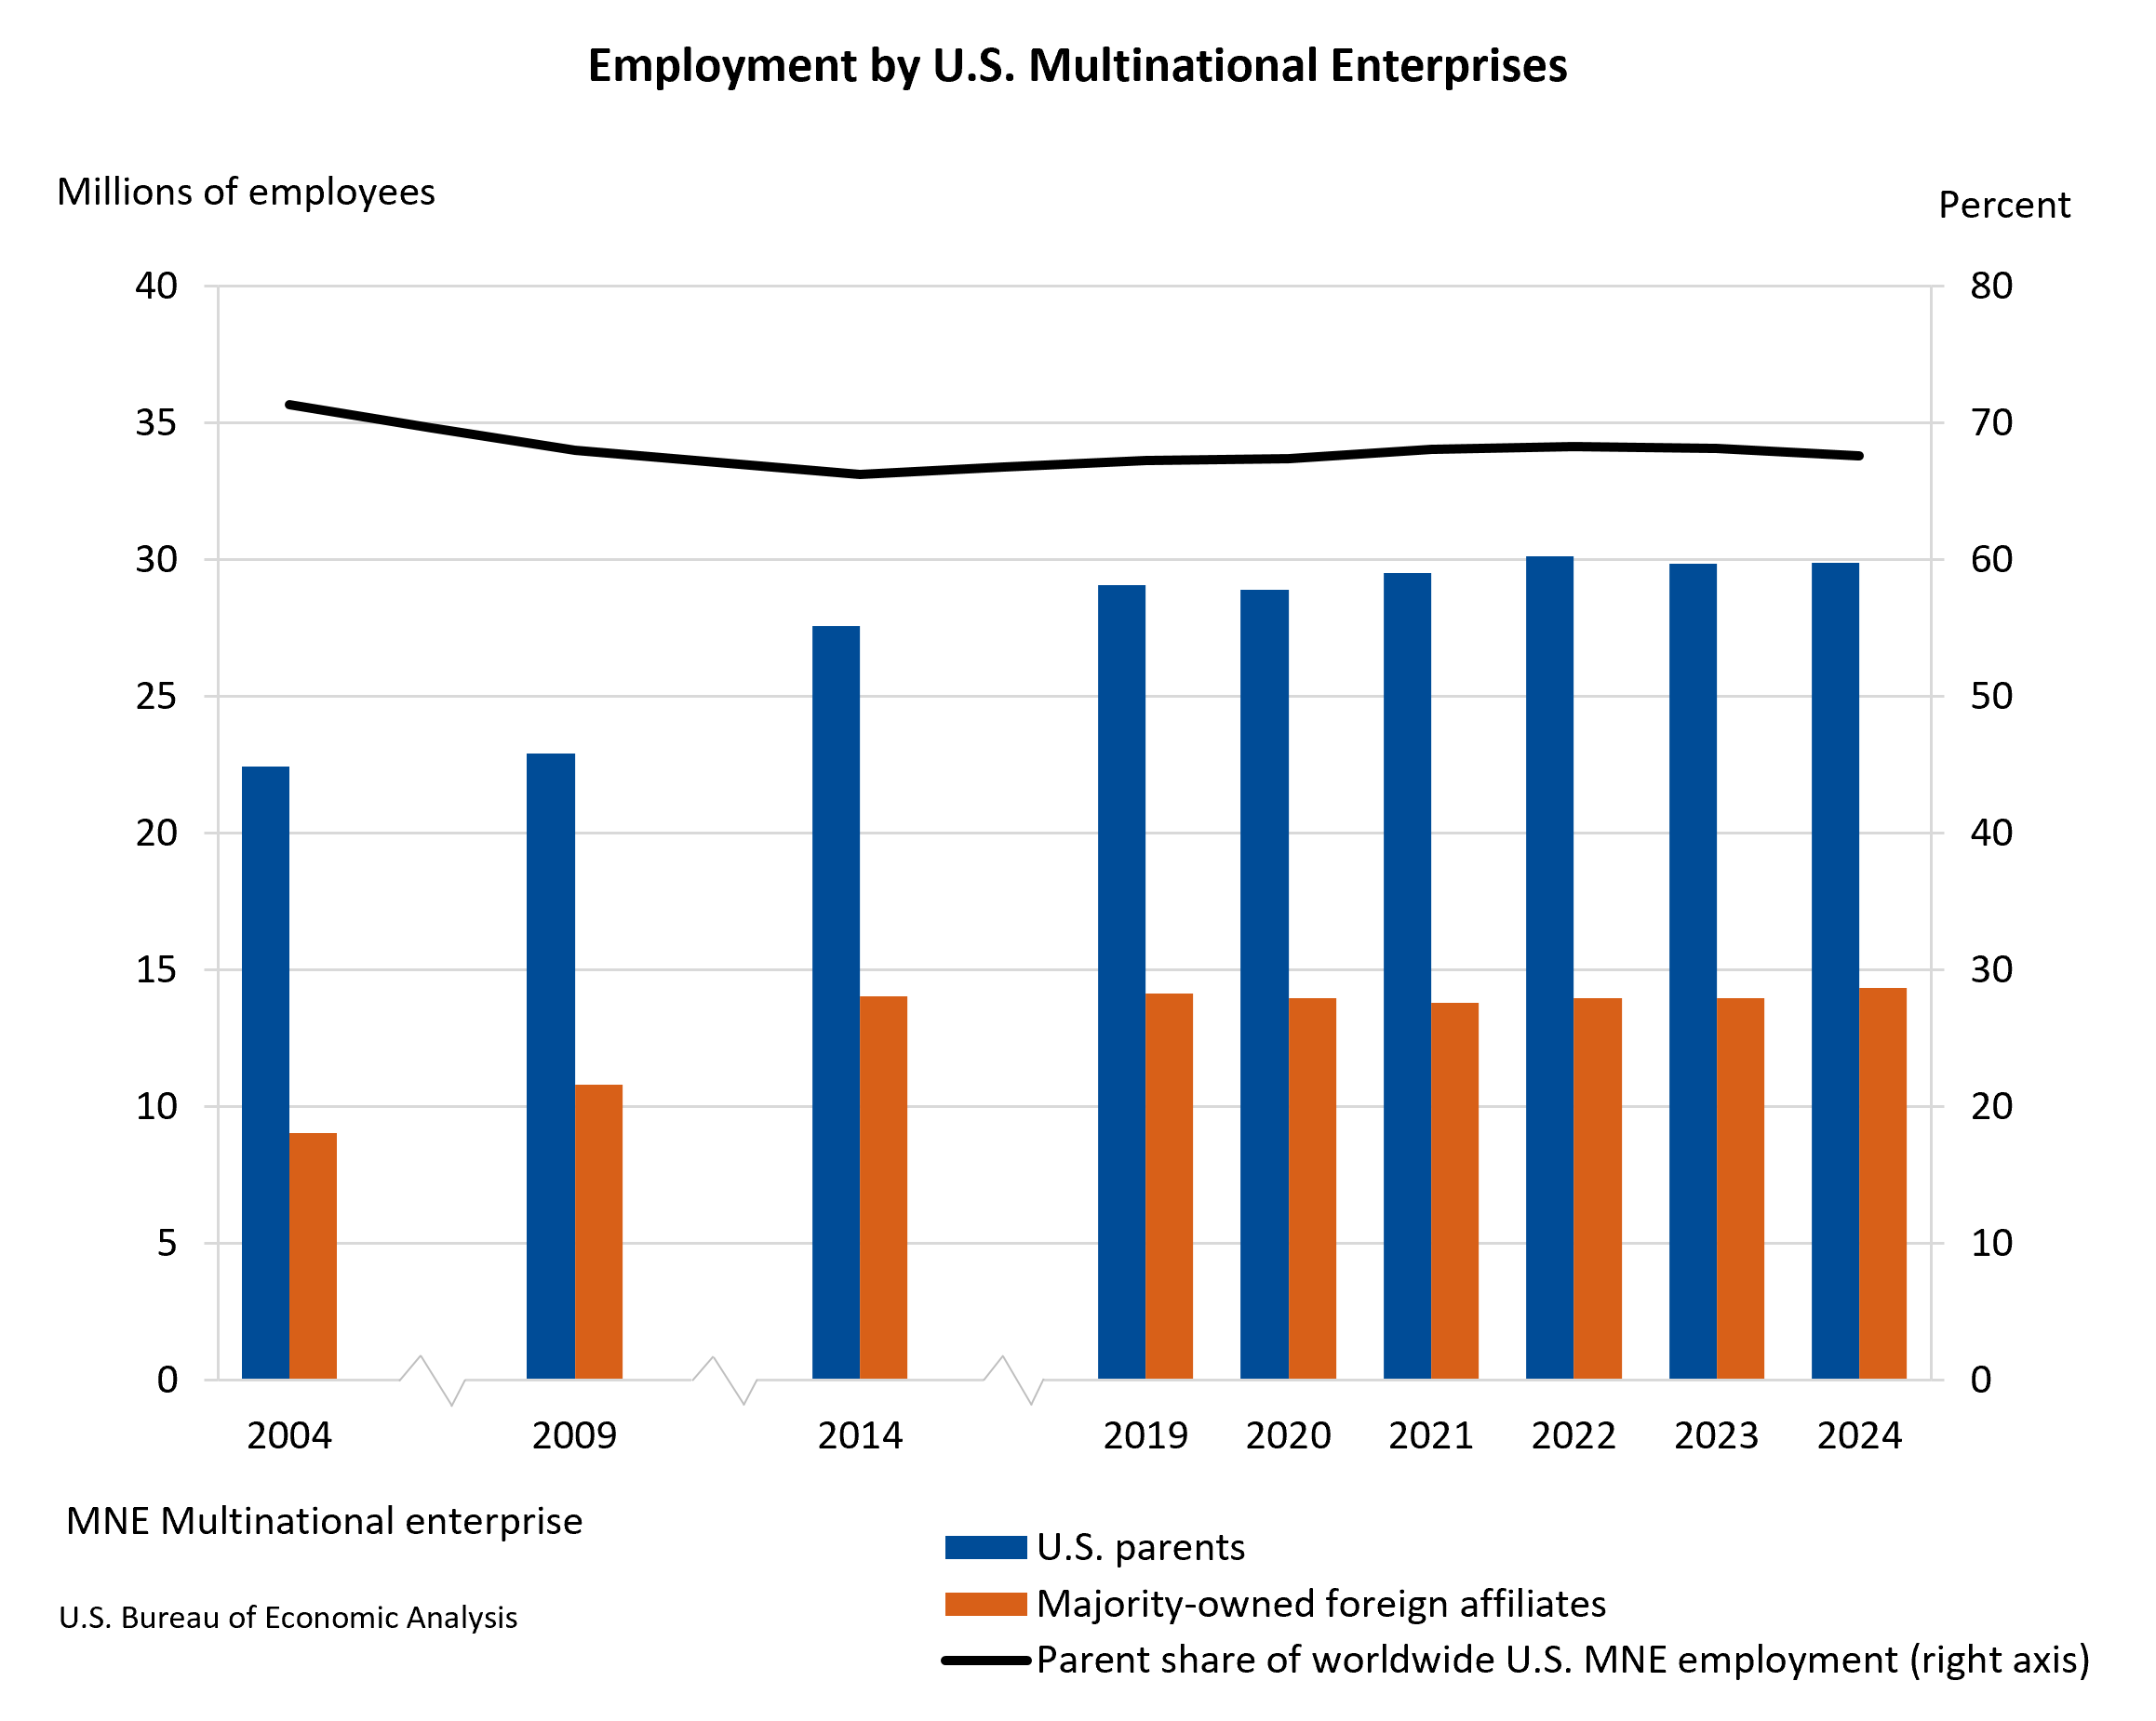
U.S. parents accounted for 21.7 percent of total private industry employment in the United States in 2024, down from 21.9 percent in 2023. Employment by U.S. parents was largest in manufacturing, in “other industries,” led by transportation and warehousing, and in retail trade. Employment abroad by foreign affiliates was largest in India, Mexico, and the United Kingdom.
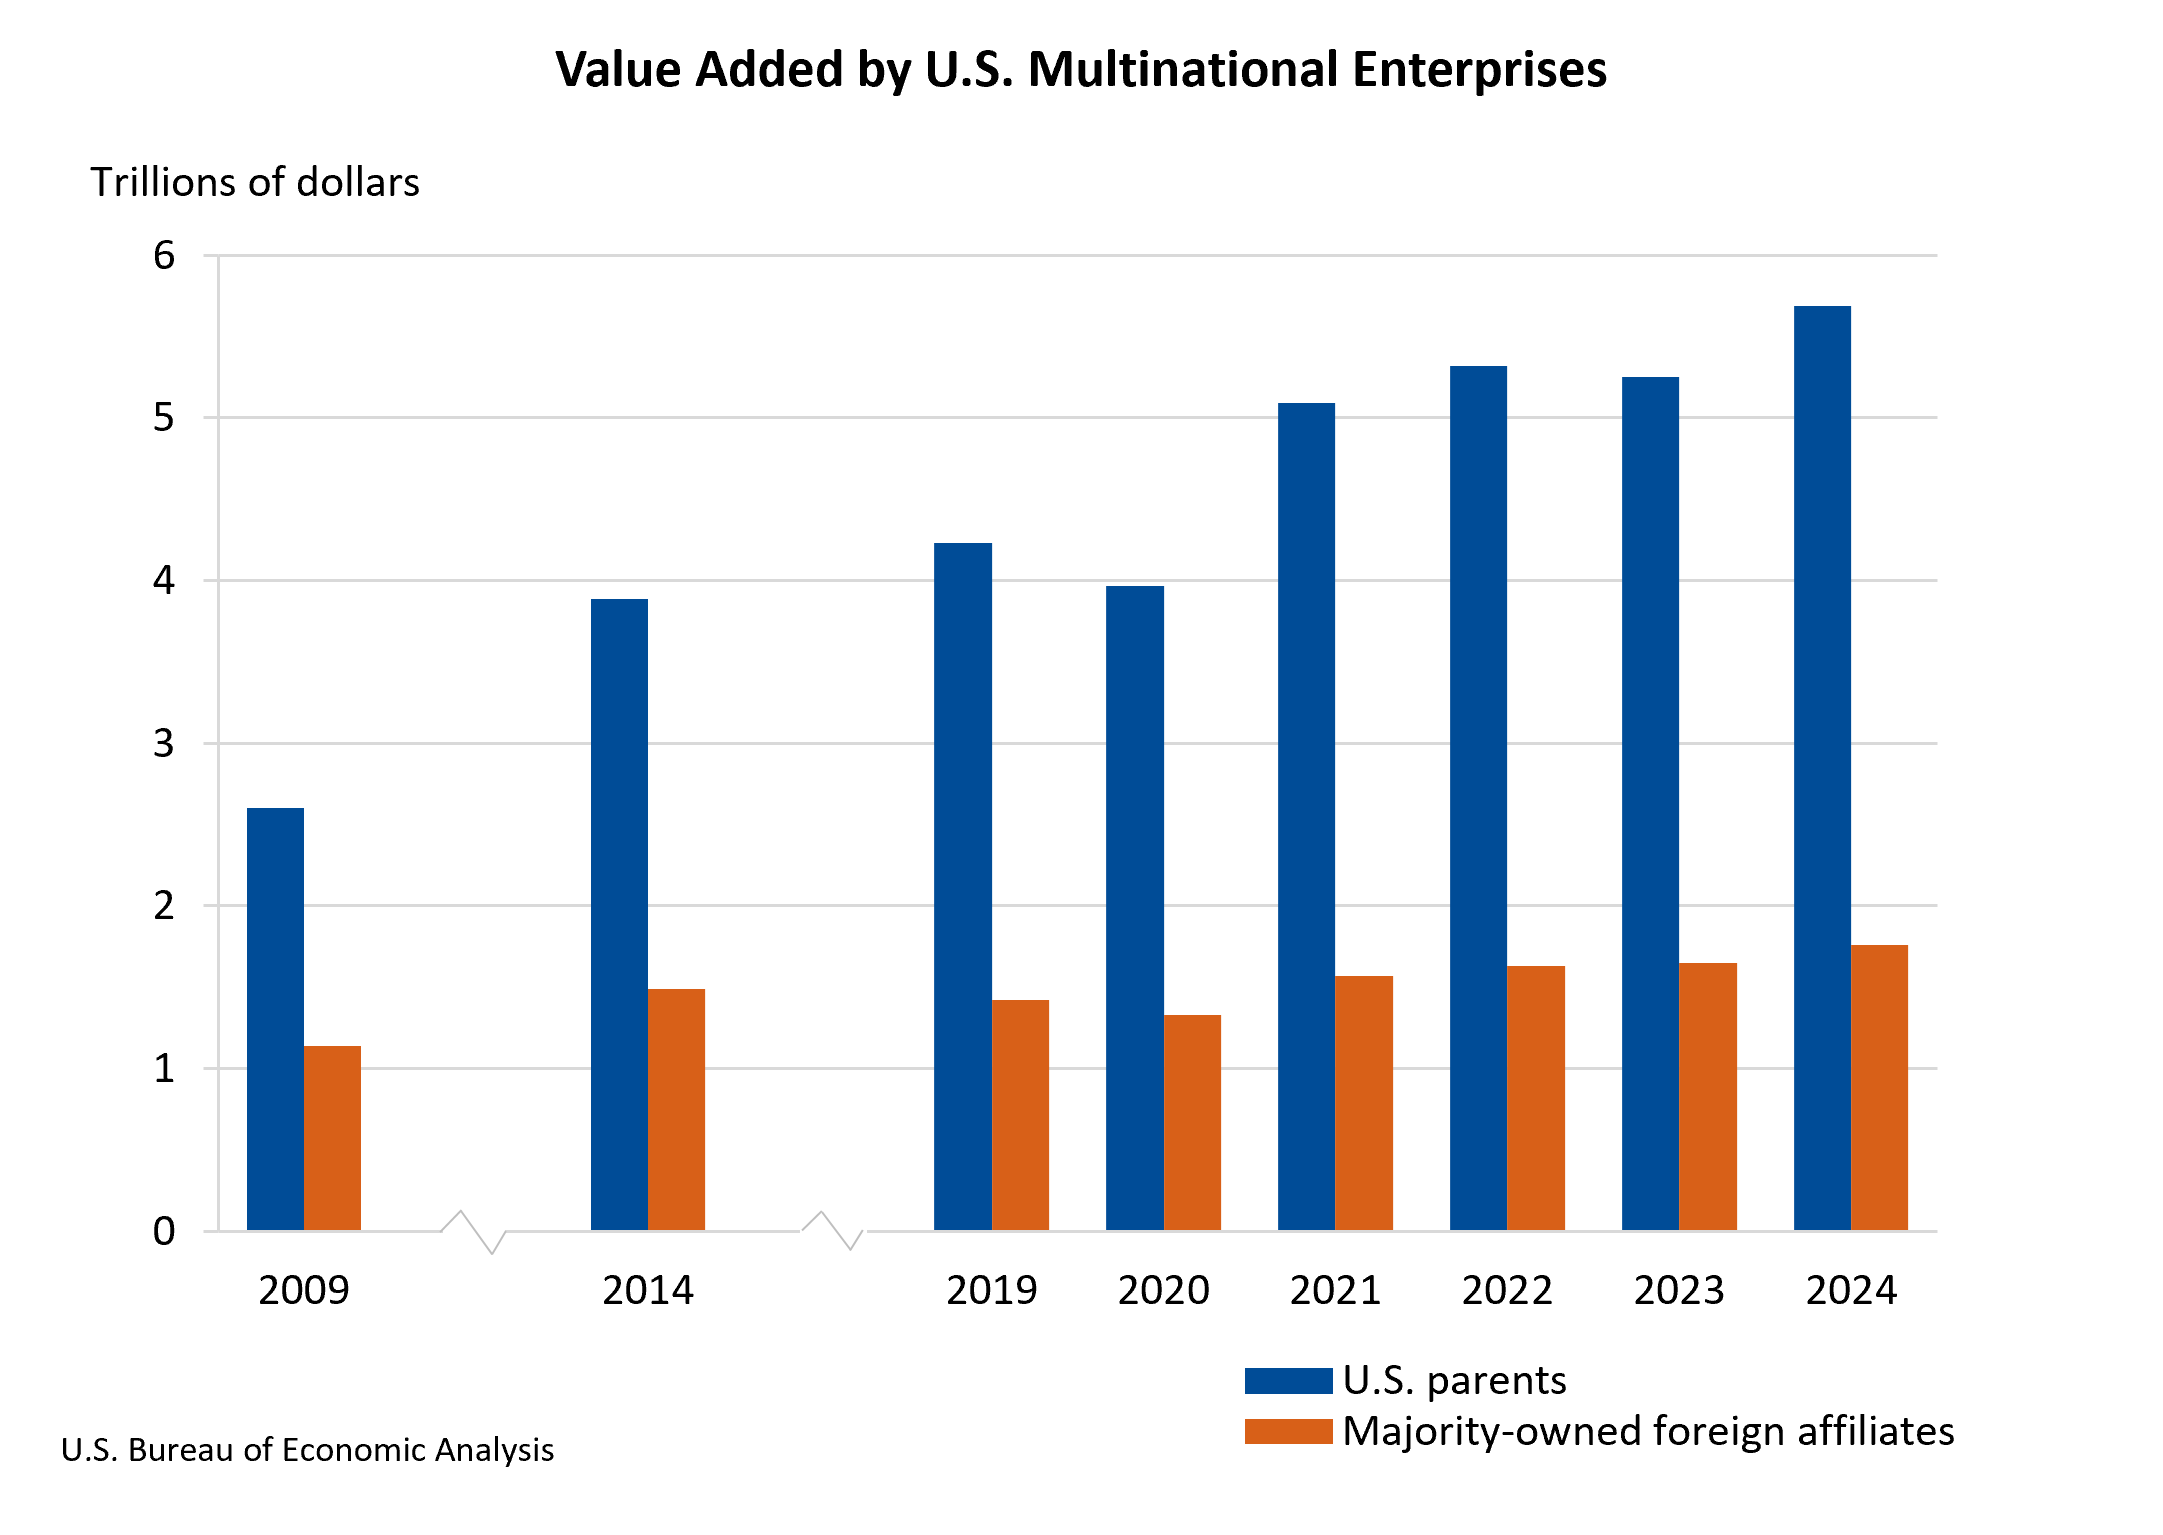
Worldwide current-dollar value added of U.S. MNEs increased 8.0 percent to $7.4 trillion in 2024. Value added by U.S. parents, a measure of U.S. parents’ direct contribution to U.S. gross domestic product, increased 8.5 percent to $5.7 trillion. U.S parents accounted for 21.8 percent of total U.S. private-industry value added, up from 21.2 percent in 2023. Foreign affiliate value added increased 6.5 percent to $1.8 trillion. Value added by foreign affiliates was largest in the United Kingdom, Ireland, and Canada.
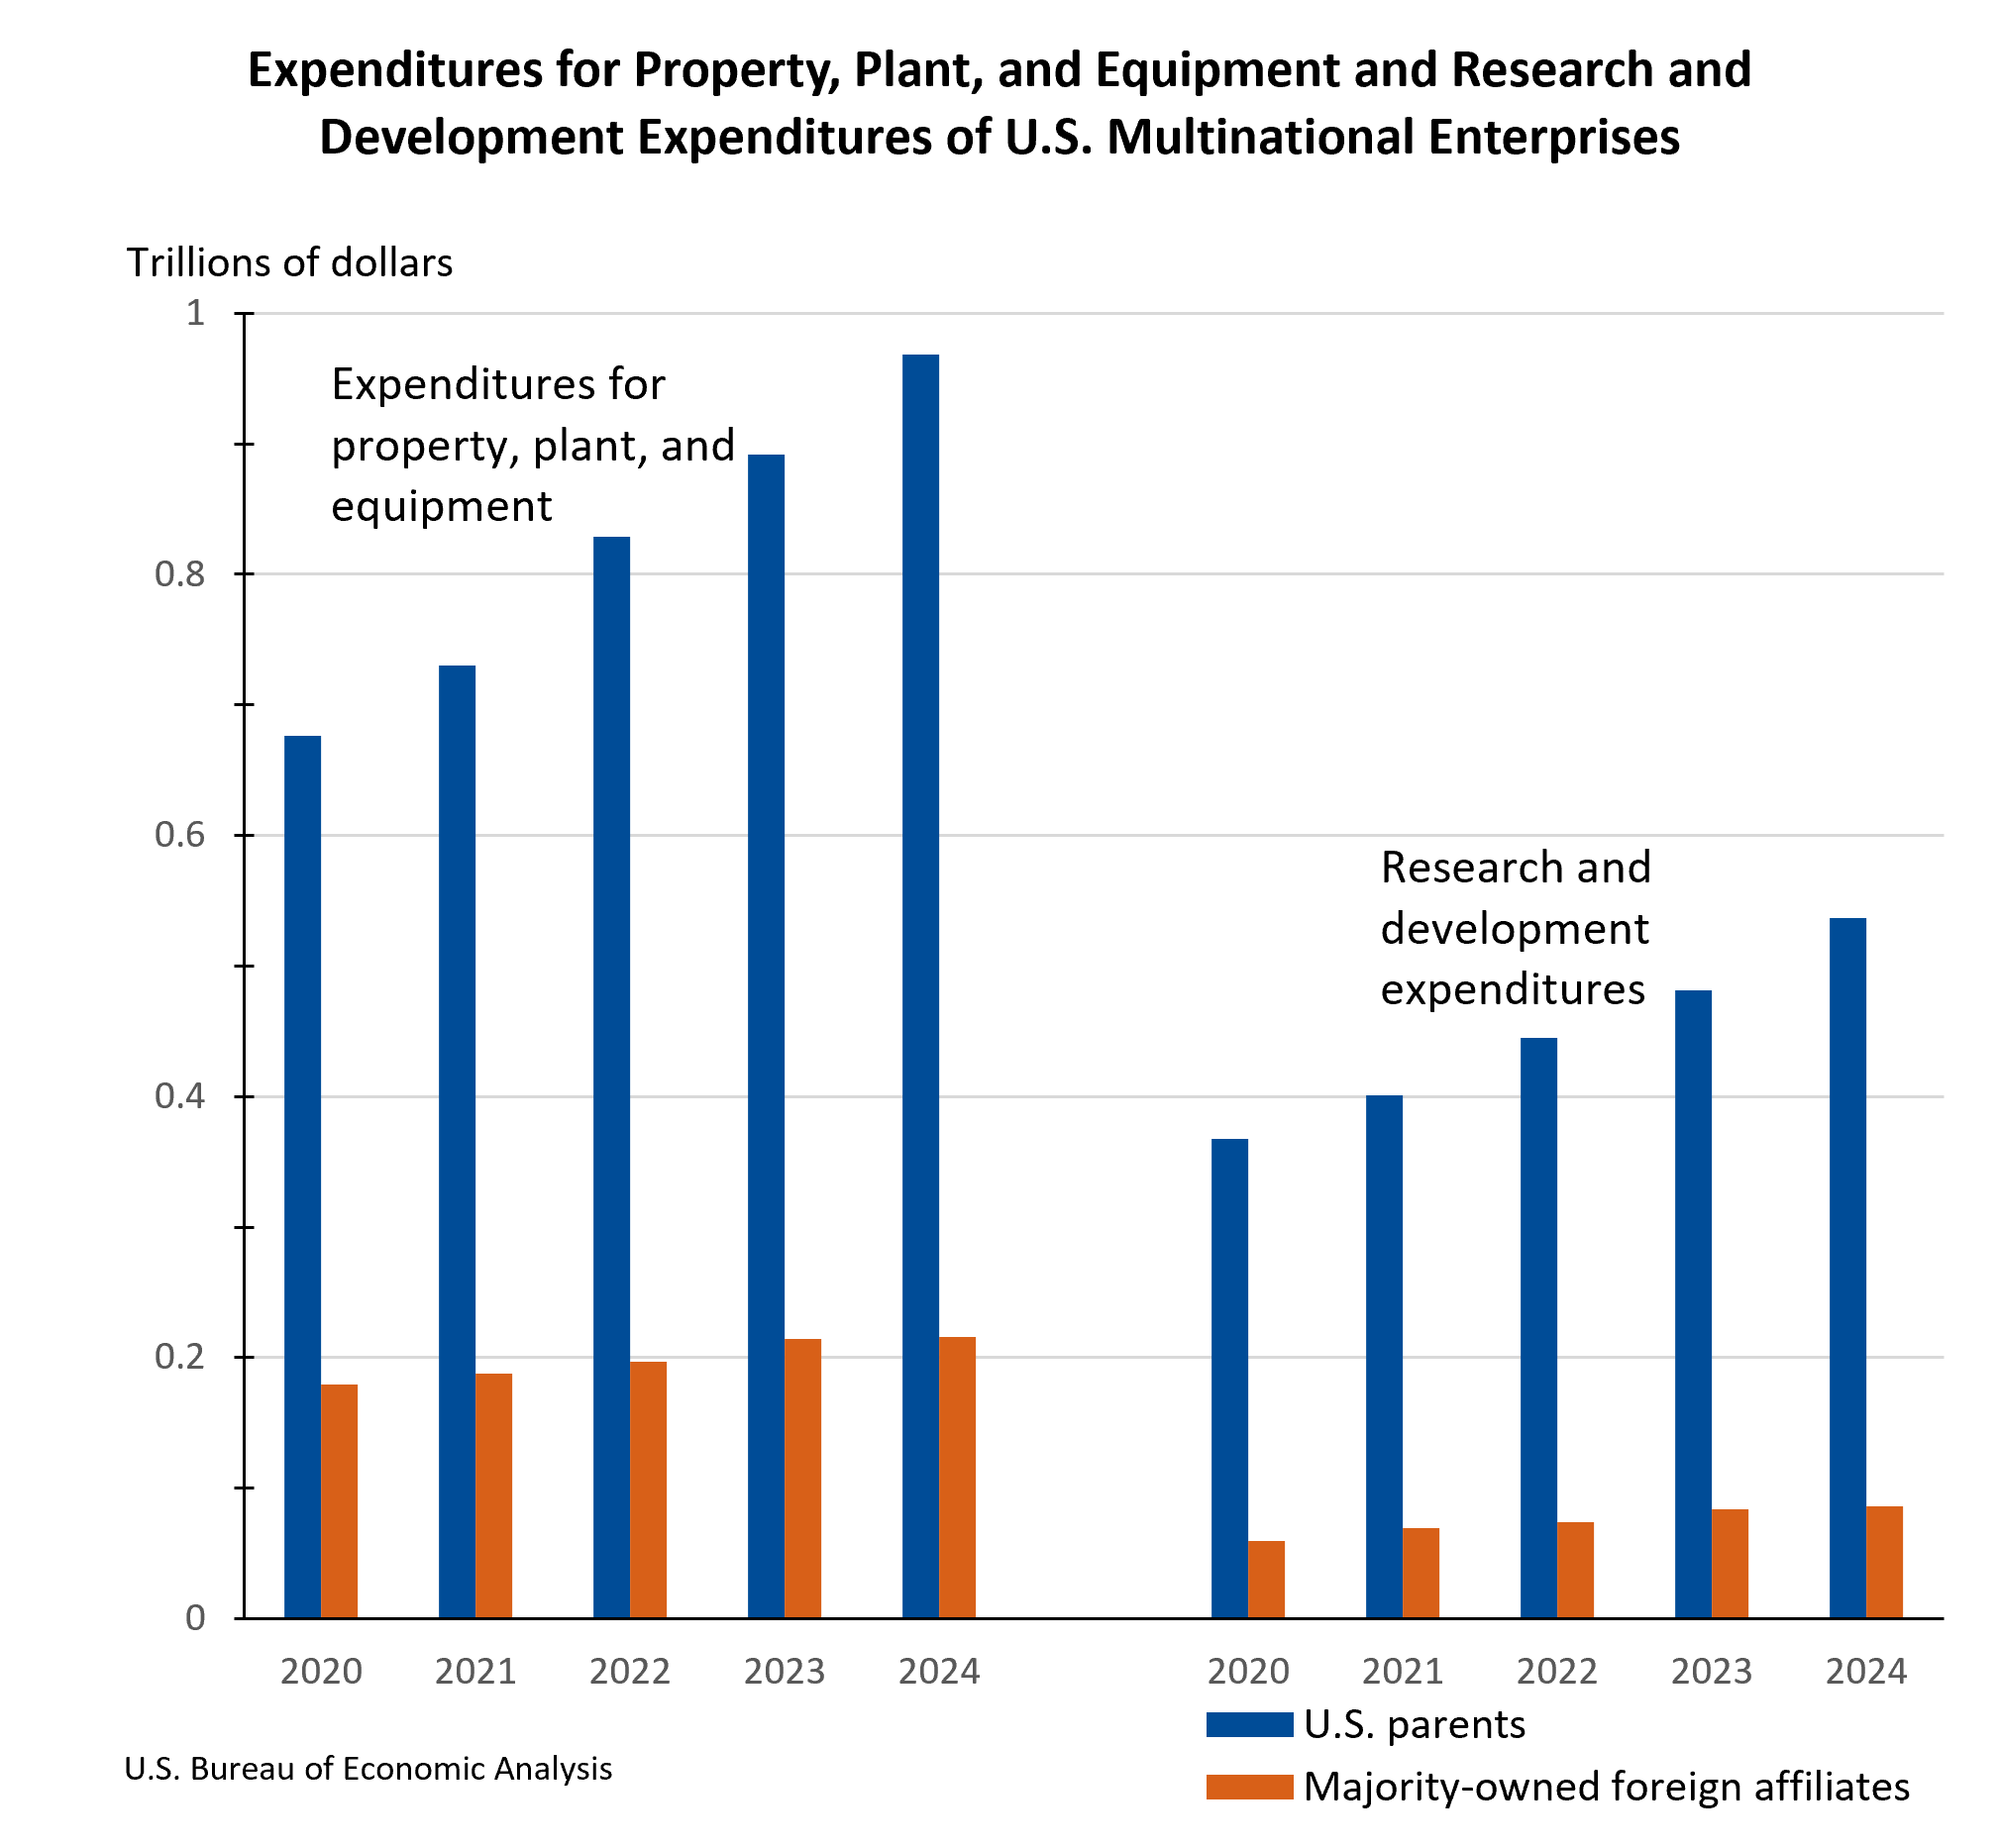
Worldwide expenditures for property, plant, and equipment of U.S. MNEs increased 7.1 percent to $1.2 trillion. Expenditures by U.S. parents accounted for $968.7 billion, representing 36.5 percent of all U.S. private-business capital expenditures. Expenditures by foreign affiliates accounted for $216.2 billion.
Worldwide research and development (R&D) expenditures of U.S. MNEs increased 10.1 percent to $622.7 billion. U.S. parents accounted for expenditures of $536.5 billion, representing 69.6 percent of business R&D performed in the United States. Foreign affiliates accounted for expenditures of $86.2 billion.
Additional statistics on the activities of U.S. parent companies and their foreign affiliates, including sales, balance sheet and income statement items, compensation of employees, trade in goods, and more are available on BEA’s website. More industry detail for U.S. parents and more industry and country detail for foreign affiliates are also available on the website.
Updates to the statistics
Statistics for 2023 were revised to incorporate newly available and revised source data. Preliminary statistics for 2023 were released in August 2025.
| U.S. parents | Majority-owned foreign affiliates | |||
|---|---|---|---|---|
| Preliminary estimate | Revised estimate | Preliminary estimate | Revised estimate | |
| Number of employees (thousands) | 29,890.6 | 29,841.8 | 14,008.4 | 13,958.5 |
| Value added | 5,265.5 | 5,245.4 | 1,645.6 | 1,648.4 |
| Expenditures for property, plant, and equipment | 886.1 | 891.9 | 216.2 | 214.0 |
| Research and development expenditures | 476.6 | 481.5 | 81.7 | 84.1 |
| U.S. Bureau of Economic Analysis | ||||
Related Data Tables
For the 2024 activities of U.S. multinational enterprises statistics highlighted in this release, as well as estimates for earlier years, see the below data tables in BEA’s Interactive Data Application and comprehensive data tables.
Selected data
Selected Financial and Operating Data of U.S. Parents, by Industry of U.S. Parent
Selected Data for Foreign Affiliates and U.S. Parents in All Industries
Employment
U.S. Parent Companies Employment, by Industry of U.S. Parent Company
Foreign Affiliates Employment, by Country
Foreign Affiliates Employment, by Industry of Affiliate
Foreign Affiliates Employment, by Country and Industry
Value added
U.S. Parent Companies Value Added, by Industry of U.S. Parent Company
Foreign Affiliates Value Added, by Country
Foreign Affiliates Value Added, by Industry of Affiliate
Expenditures for property, plant, and equipment (capital expenditures)
U.S. Parent Companies Capital Expenditures, by Industry of U.S. Parent Company
Foreign Affiliates Capital Expenditures, by Country
Foreign Affiliates Capital Expenditures, by Industry of Affiliate
R&D expenditures
U.S. Parent Companies R&D Expenditures, by Industry of U.S. Parent Company
Foreign Affiliates R&D Expenditures, by Country
Foreign Affiliates R&D Expenditures, by Industry of Affiliate
Notes. This release includes, for the first time, statistics on U.S. parent shares of domestic activity for R&D performed and for property, plant, and equipment expenditures.
BEA has updated its disclosure avoidance method to coarsening, which includes rounding, aggregation, and the use of ranges. This allows BEA to publish more data while still providing confidentiality to BEA’s survey respondents.
Next release: August 20, 2027
Activities of U.S. Multinational Enterprises, 2025
来源:美国经济分析局 · GDP与PCE · bea.gov